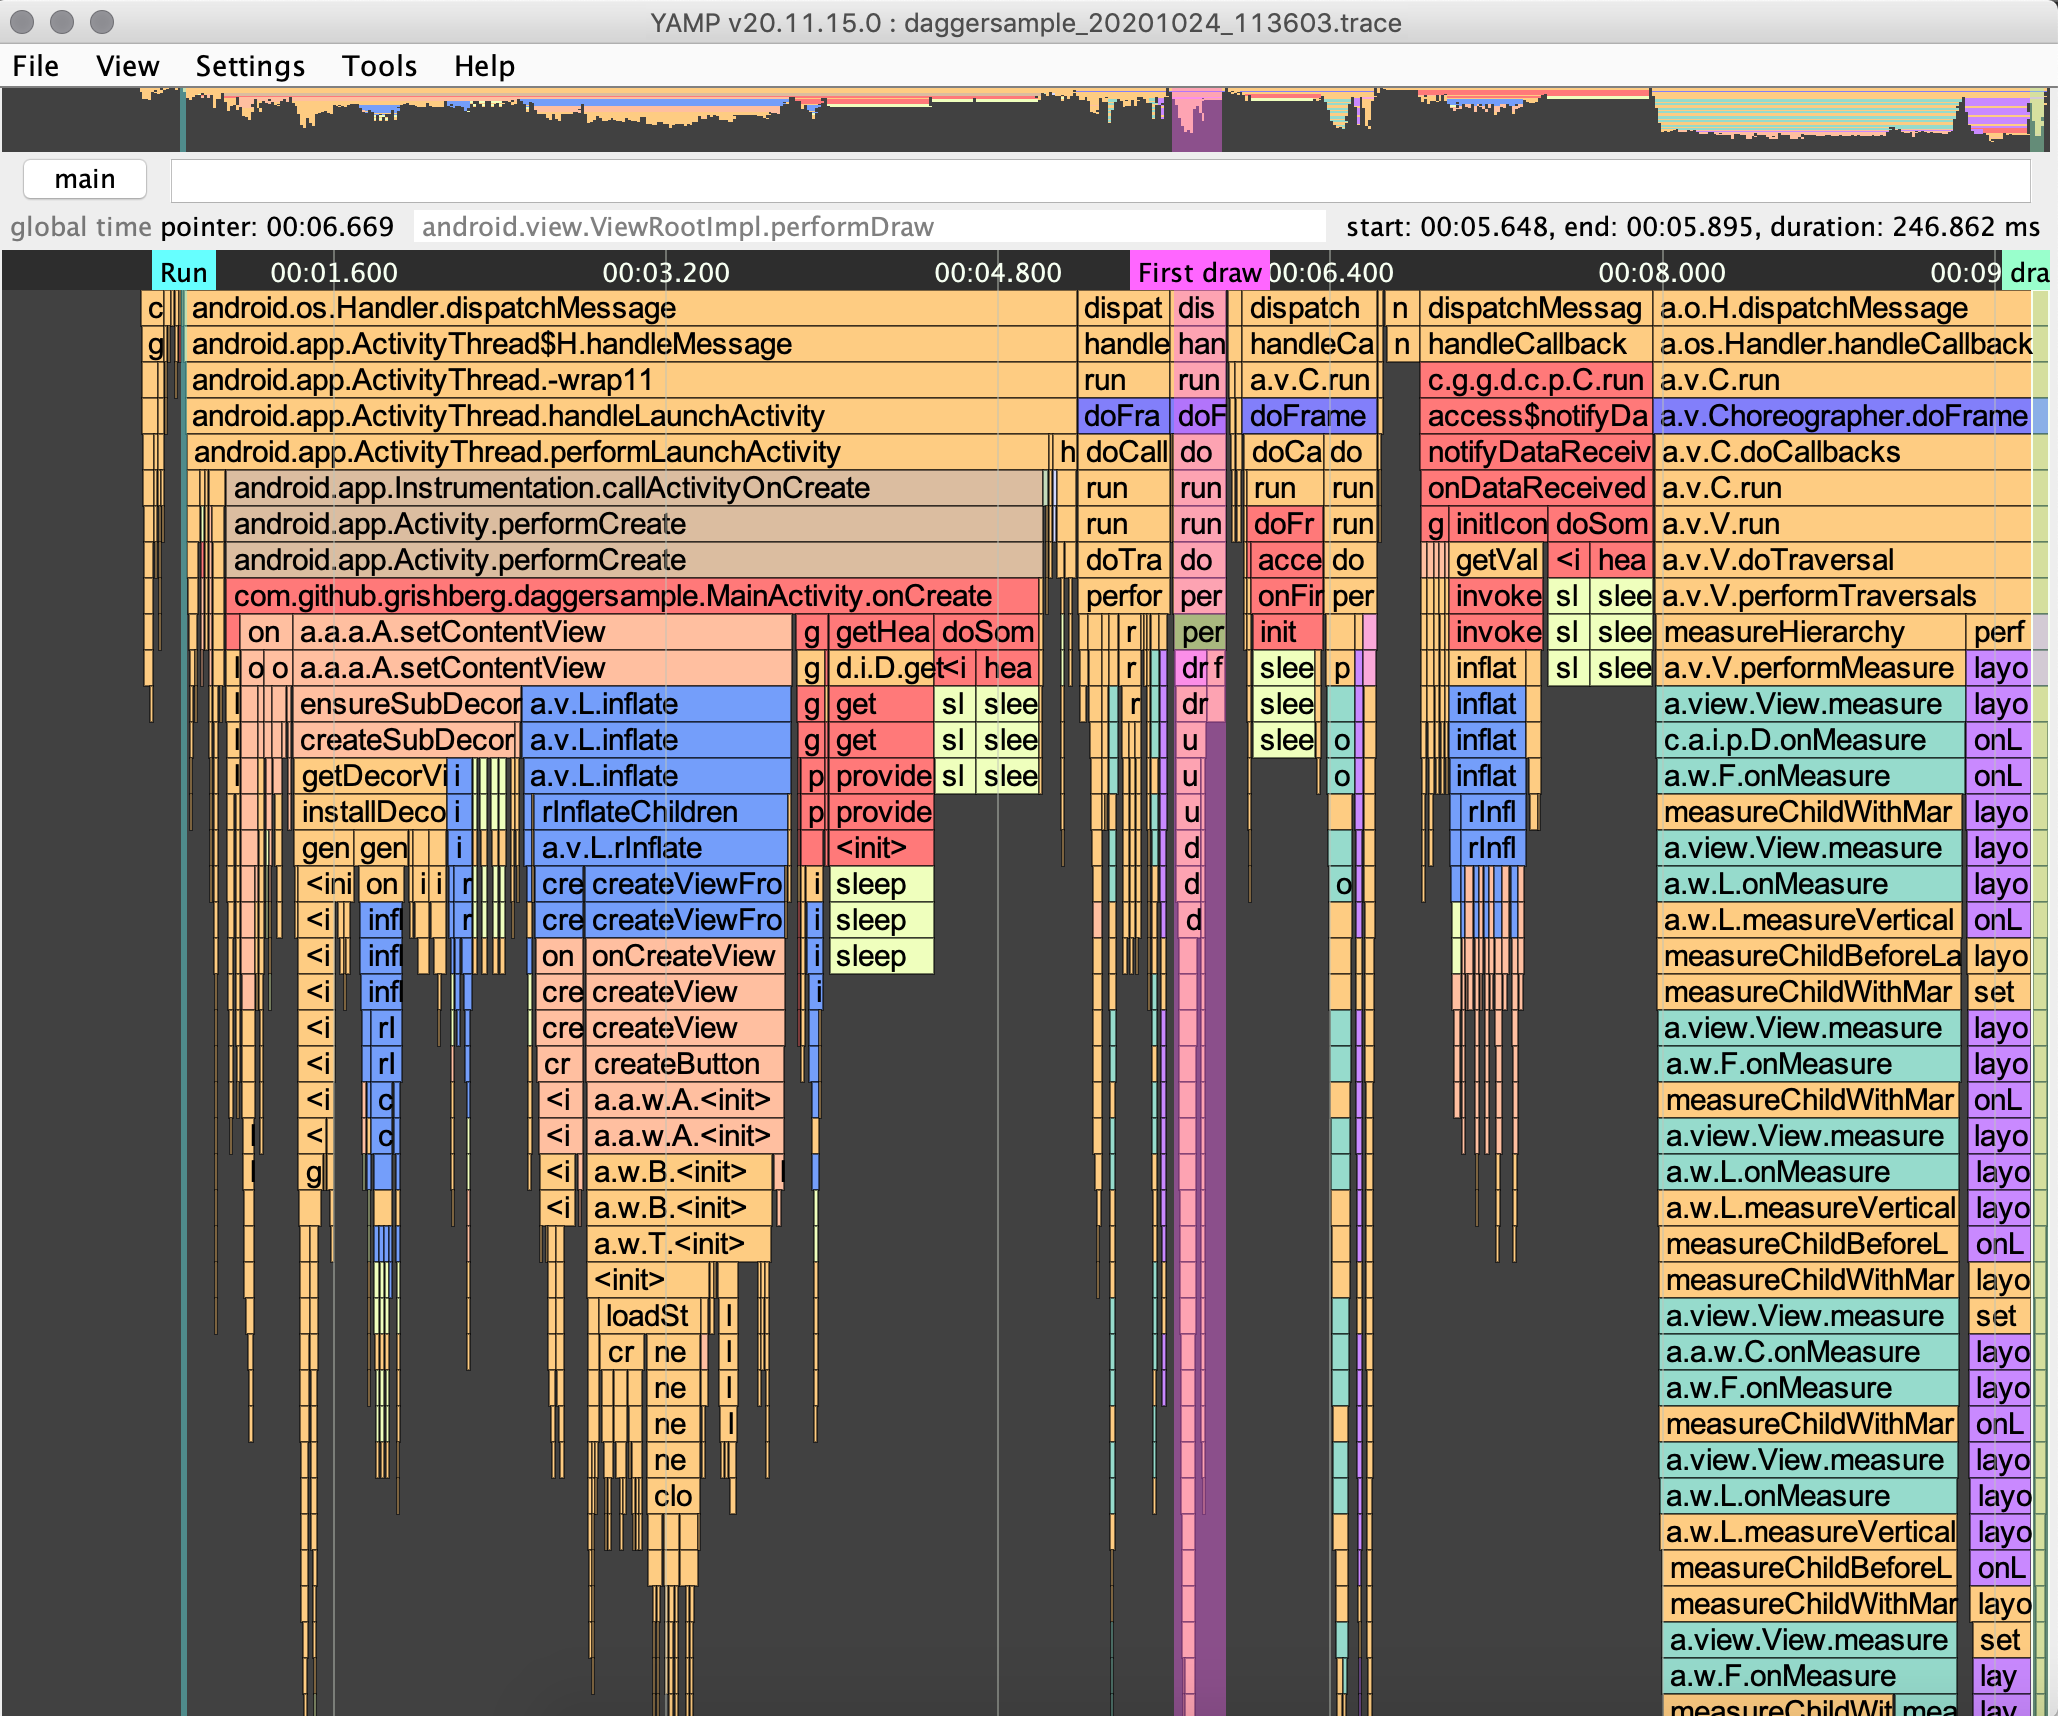
Yet Another Methods Profiler for Android (YAMP)
This is tool for analyzing method trace files .trace files like Android Profiler but works faster, has convenient control, user bookmarks and custom highlighting.
For Russian speaking developers there is a video guide
Download
Installation
Android Studio plugin marketplace
- Find YAMP plugin and install
- Start through the
Tools->Launch YAMPmenu or by searching for “Launch YAMP” in “Find Actions” (osx: cmd+shift+a, windows/linux: ctrl+shift+a)
https://plugins.jetbrains.com/plugin/16167-yamp
Standalone app
- Download android-methods-profiler_{YOUR_VERSION}.jar
- execute
java -jar android-methods-profiler_{YOUR_VERSION}.jar
Keymap
Read about keymap there
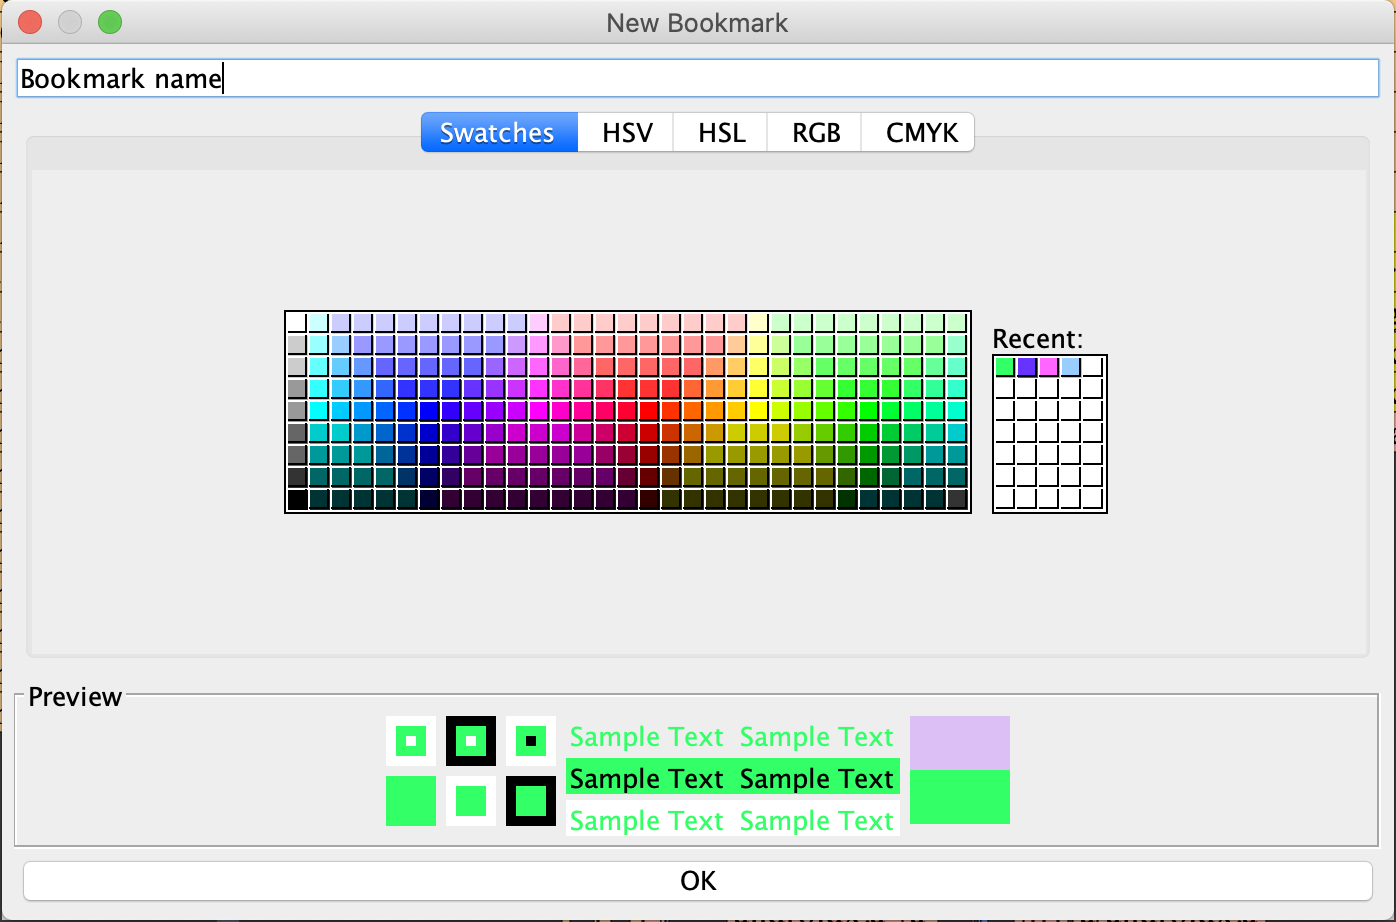
Bookmarks
Helps to mark some methods in trace.
Bookmarks are saved automatically after you add new one.
Bookmarks are stored in $HOME/android-profile-viewer/markers folder.
The easiest way to add bookmark is to click on the method and press m key.
In the opened dialog enter bookmark name and select color.
You can share current opened trace file with your bookmarks in single
file by File -> Export trace with bookmarks or Ctrl + Shift + e ,
then select new file name and send single *.twb file to anyone
who has AndroidMethodsProfiler v20.06.22.0 or newer.
*.twbfile is zip archive with .trace and .marker files
New Trace Recording
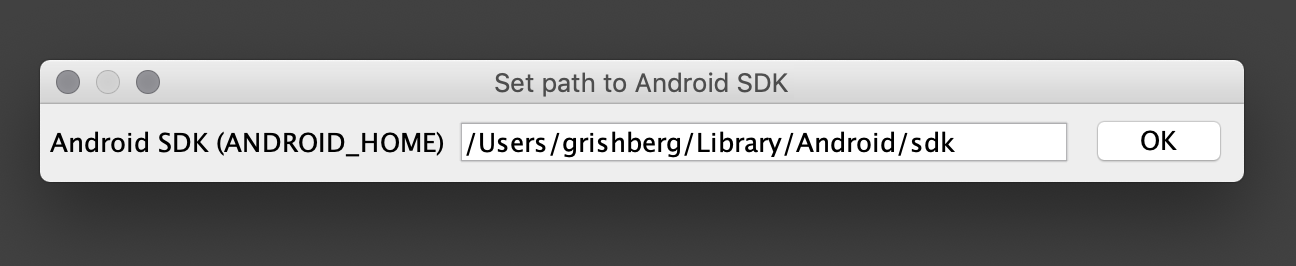
After first launch you will see Setup android sdk home dialog, please
enter path to Android SDK Home like $ANDROID_HOME and it will be stored in settings file
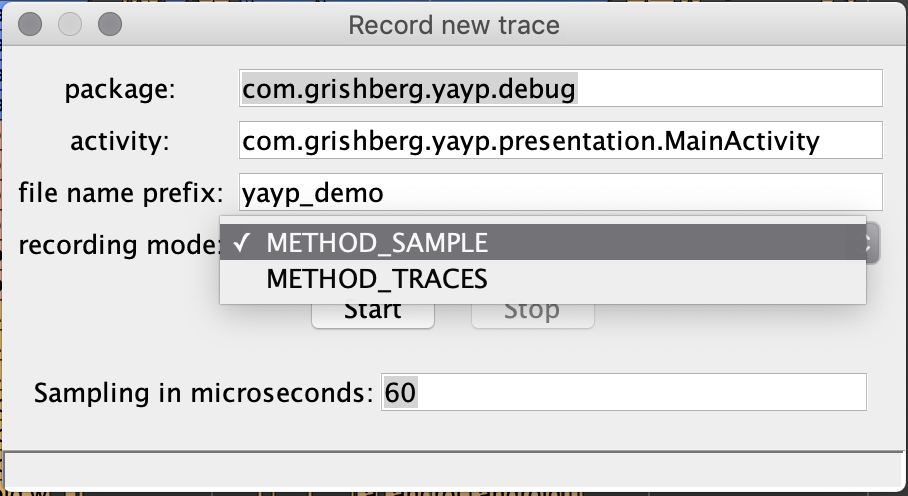
After clicking on New Trace icon or pressing Ctrl + n record new trace dialog will be opened.
Saved .trace files will be placed in $HOME/android-profile-viewer/trace folder
In the opened dialog package field is required, activity name is optional.
If you entered activity name then application will start after clicking Start button.
If activity field is empty - you need to start application manually, or it can already be running.
Sampling parameter: The lower the value, the more accurate the report will be, but the greater the load on the mobile phone CPU. For old device, like nexus 5X I prefer 1000 microseconds.
You can select two record mode:
- Sample Java Methods : Captures your app’s call stack at frequent intervals during your app’s Java-based code execution.
- Trace Java Methods : Instruments your app at runtime to record a timestamp at the beginning and end of each method call.
More information about recording modes
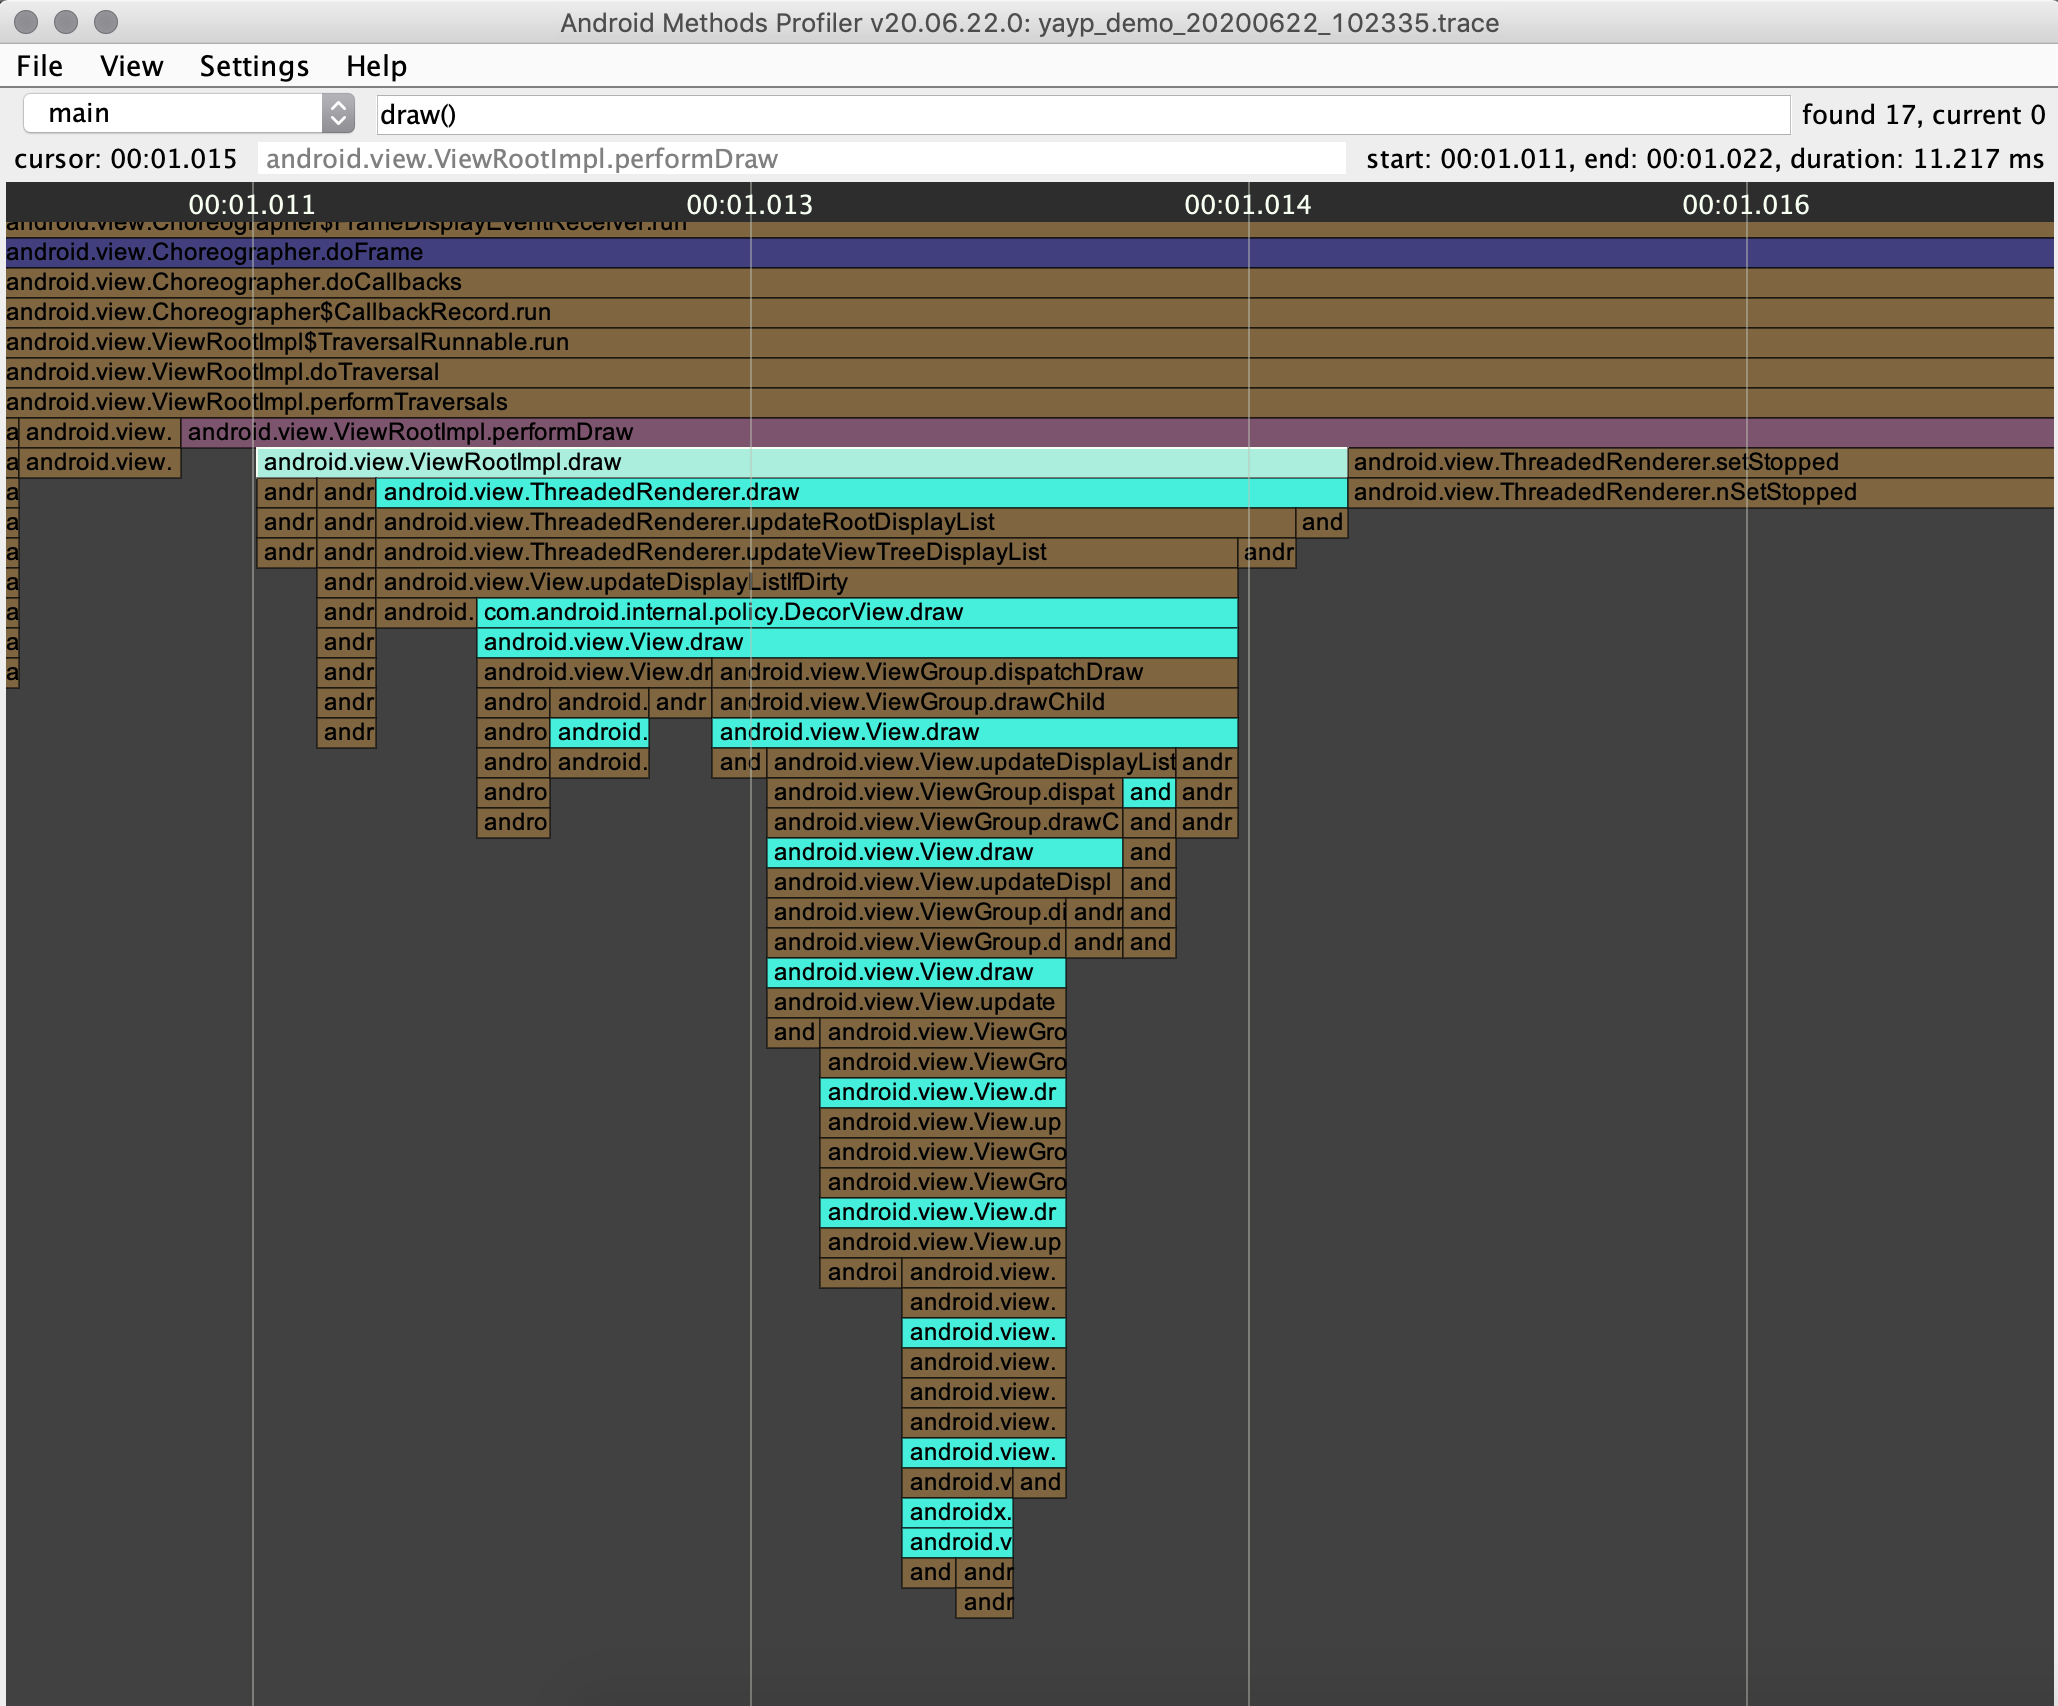
Report generator
Generates flat list of methods with duration. Can be filtered by duration and/or is current method constructor.
Highlighting:
Choreographer.doFrame
measuring
layouting
inflating
drawing
request layout
Also you can add custom highlighting:
highlighting mapping placed in $HOME/android-methods-profiler/colors.json
for example:
[
  {
    "filter": "com.example",
    "color": "FF9595"
  }
]
will highlight all methods of classes started with com.example.
colors.json will be created automatically with sample highlighting
Find class or methods
To find class or method you should press Ctrl + f or manually click to searching field. Type class name and/or method name for example SomeClass.someMethod and press Enter.
If current thread data contains any matches to the mask “*.SomeClass.someMethod.*” then these elements will be highlighted and the focus will be on the first element found.
If you want to find methods that ends with SomeClass.someMethod then type SomeClass.someMethod() and profiler will find any matches to the mask “*.SomeClass.someMethod”.
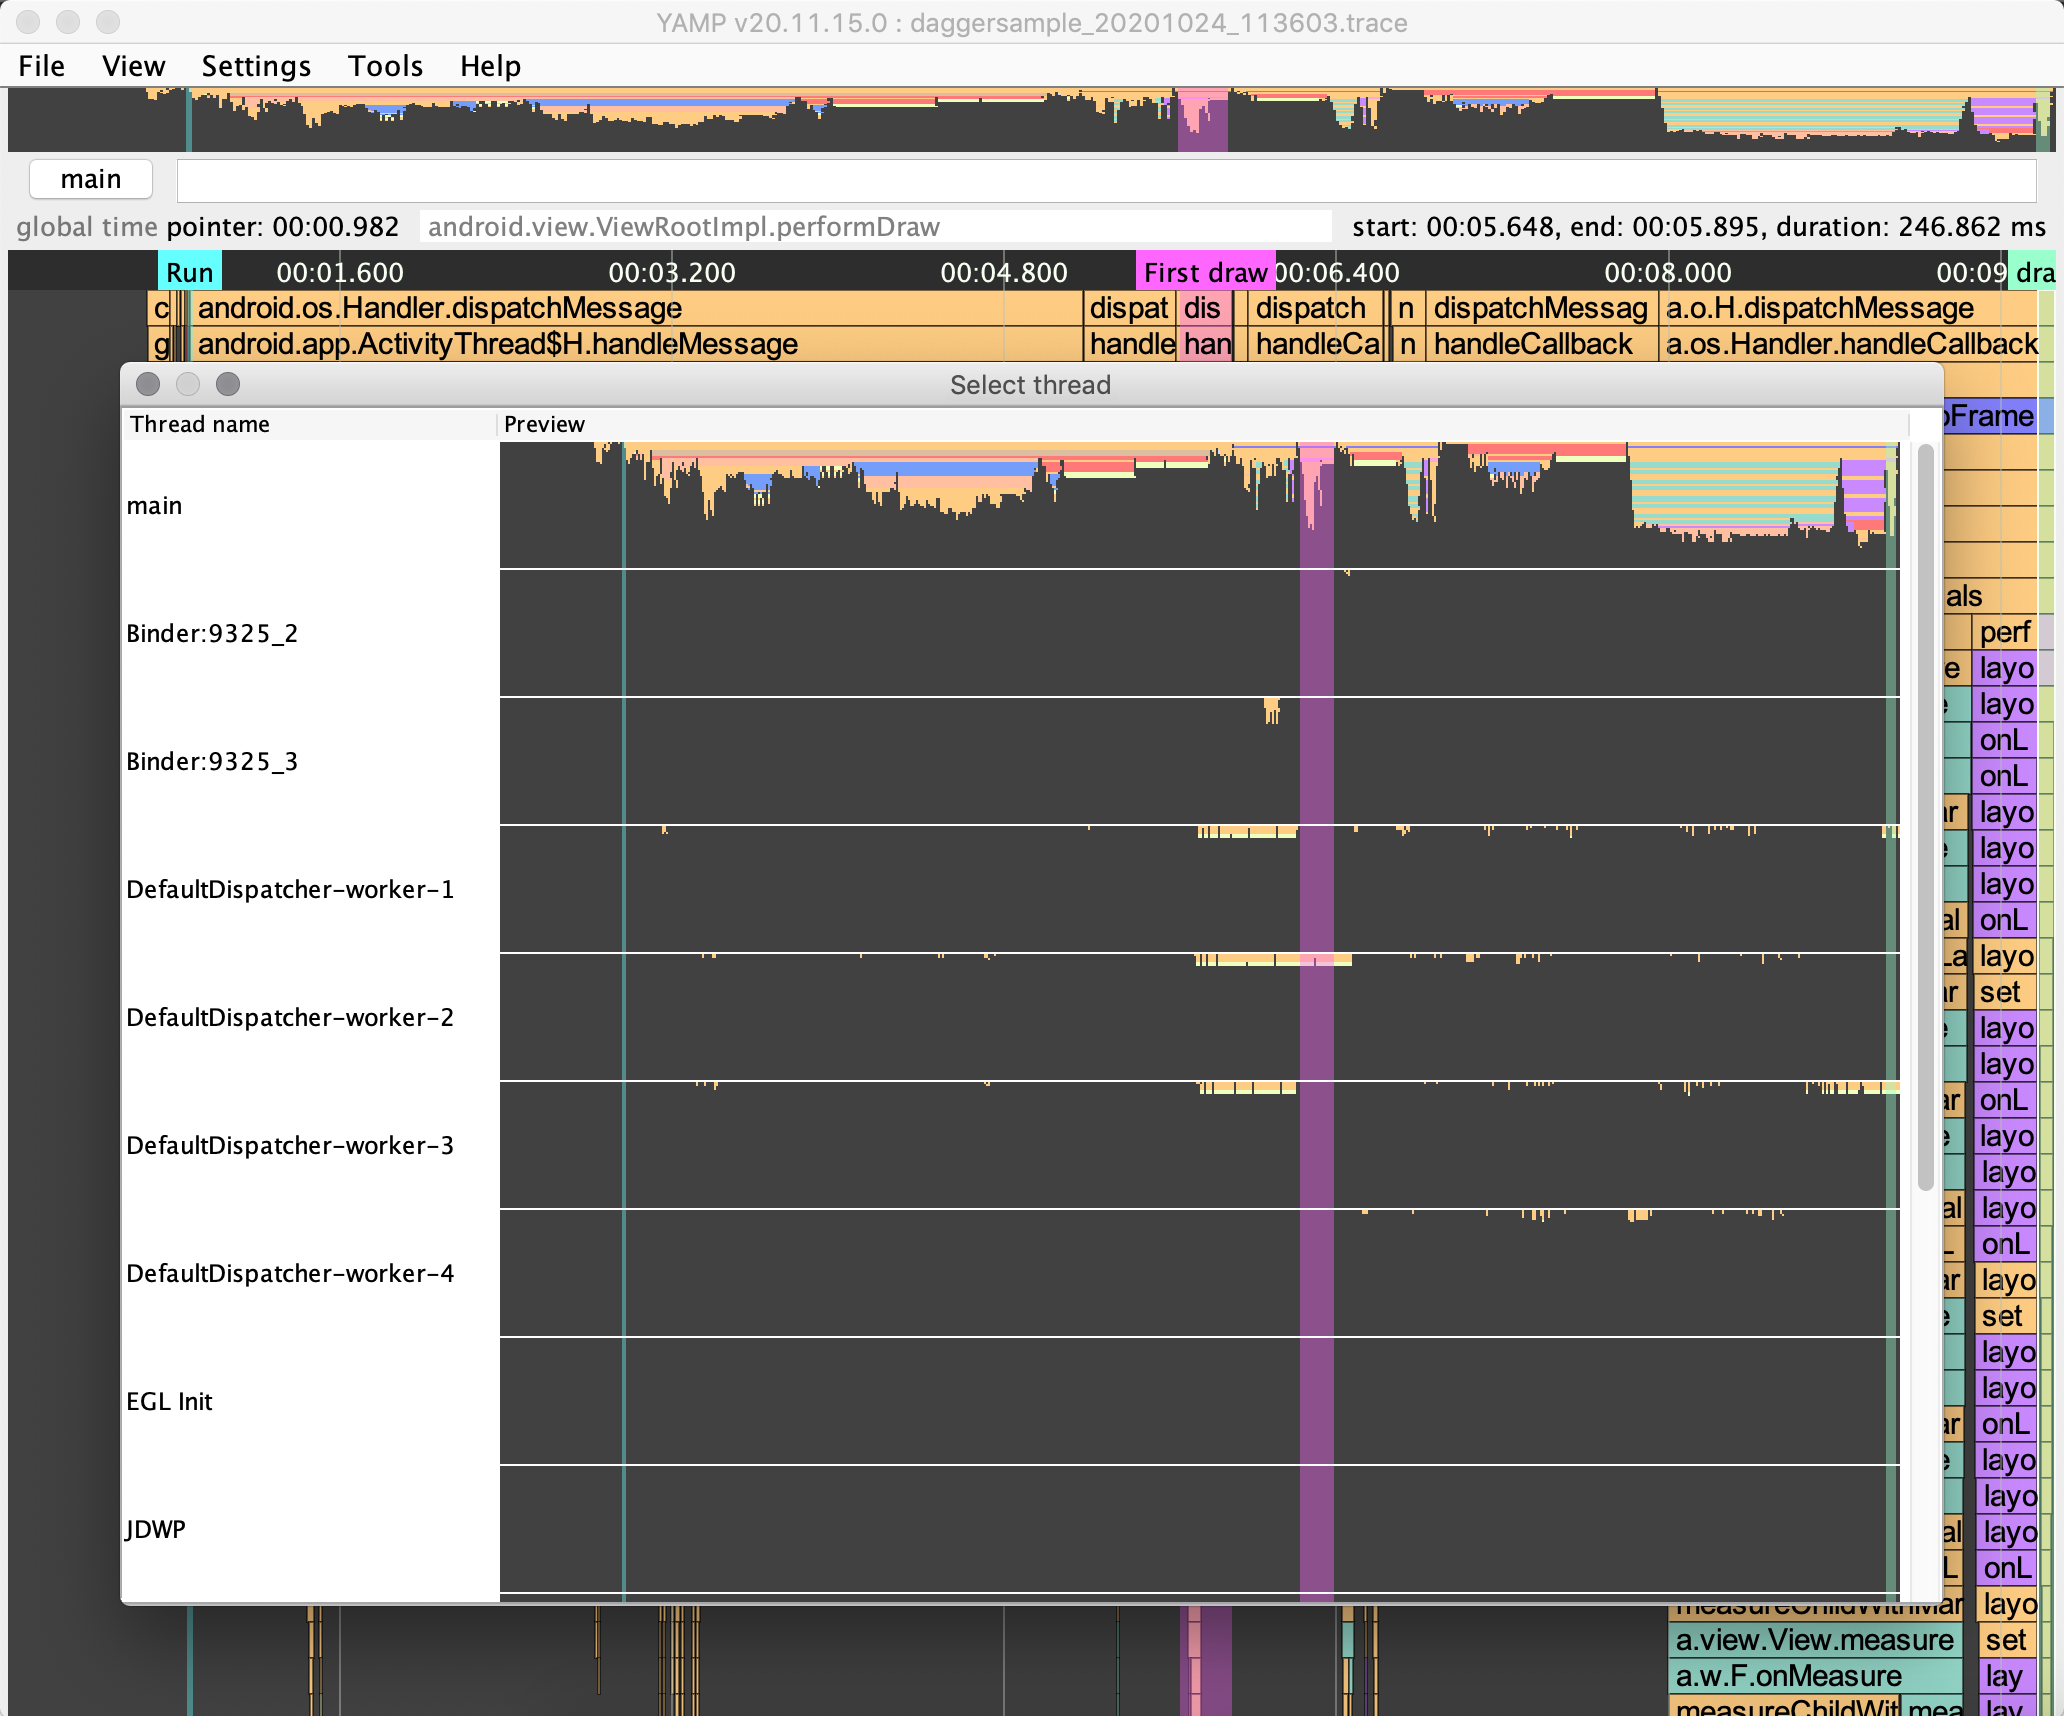
If there is no results in current thread, profiler will search it in another threads and ask you to switch to another thread if threre is any results - this can be very useful!
Compare traces
You can compare your traces with YAMP. Check README.md
Settings
Settings are stored in $HOME/android-methods-profiler/.android-methods-profiler-settings.json
Troubleshooting
If you entered activity name in New trace dialog and see “Wait for application…” status, but application is started - try to close Android Studio and record again.
To scale application on hi-res displays on linux, try to edit /opt/android-methods-profiler/app/android-methods-profiler.cfg and enter -Dsun.java2d.uiScale=2 below [JVMOptions]
Building
App
Execute ./gradlew clean :app:fatJar , release will be placed at app/build/libs
Plugin
Execute ./gradlew clean :plugin:buildPlugin , plugin will be placed at plugin/build/distributions
Support me if you like YAMP =)
ETH ERC20 tokens : 0x25Ca16AD3c4e9BD1e6e5FDD77eDB019386B68591
BNB BEP20 tokens : 0x25Ca16AD3c4e9BD1e6e5FDD77eDB019386B68591
USDT TRC20 : TSo3X6K54nYq3S64wML4M4xFgTNiENkHwC
BTC : bc1qmm5lp389scuk2hghgyzdztddwgjnxqa2awrrue
https://www.tinkoff.ru/cf/4KNjR2SMOAj
License
YAMP is released under the Apache License, Version 2.0.